SBU English Department / Internal Study


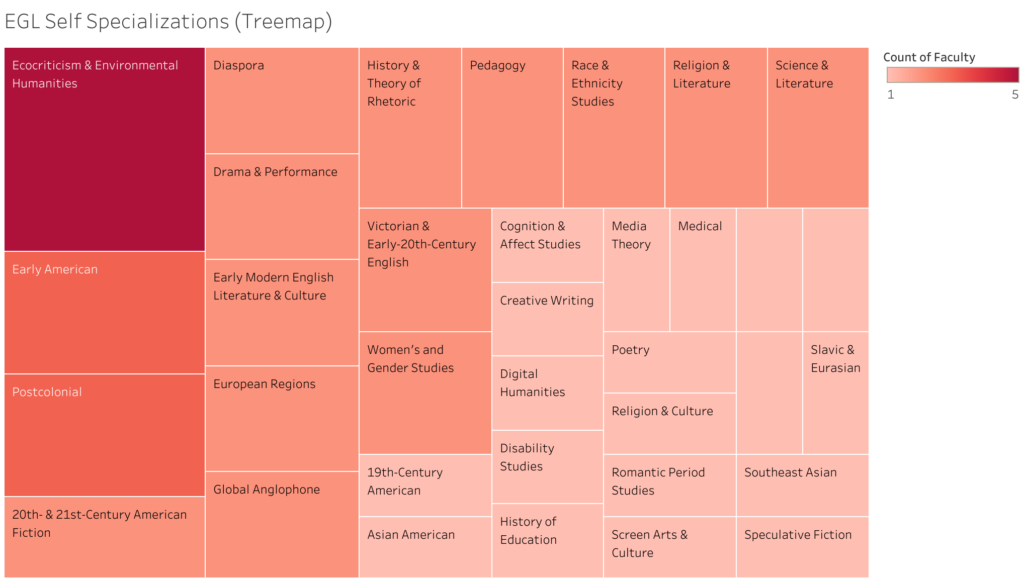
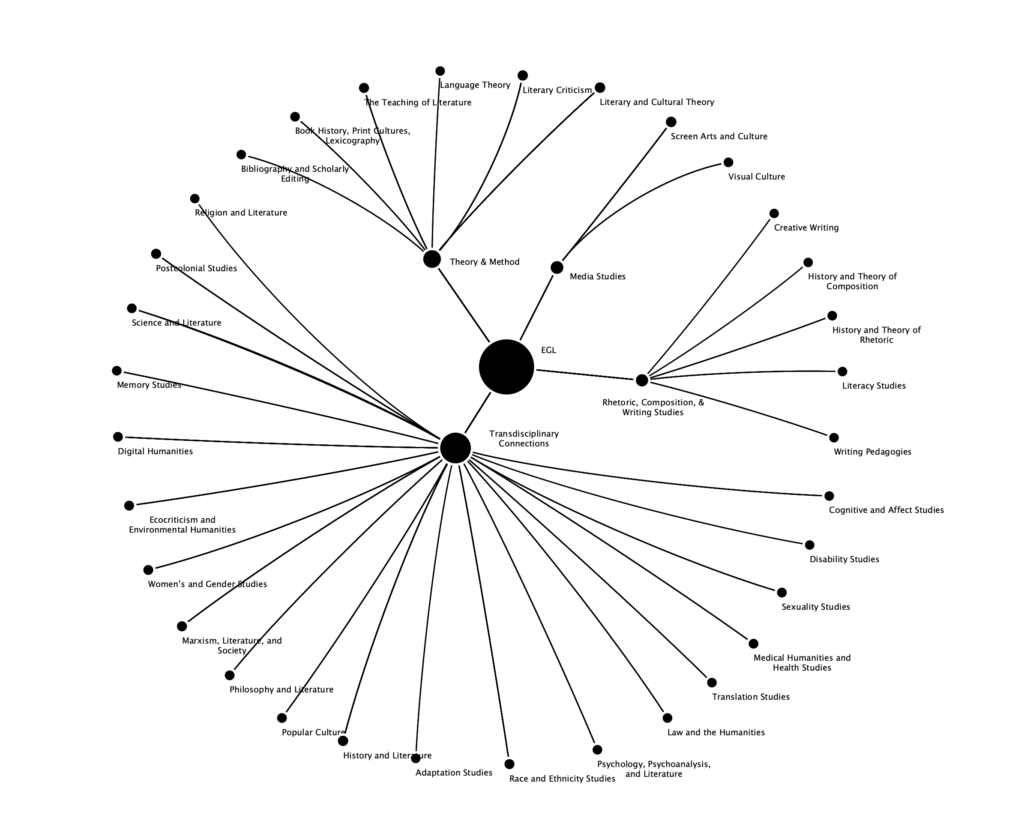
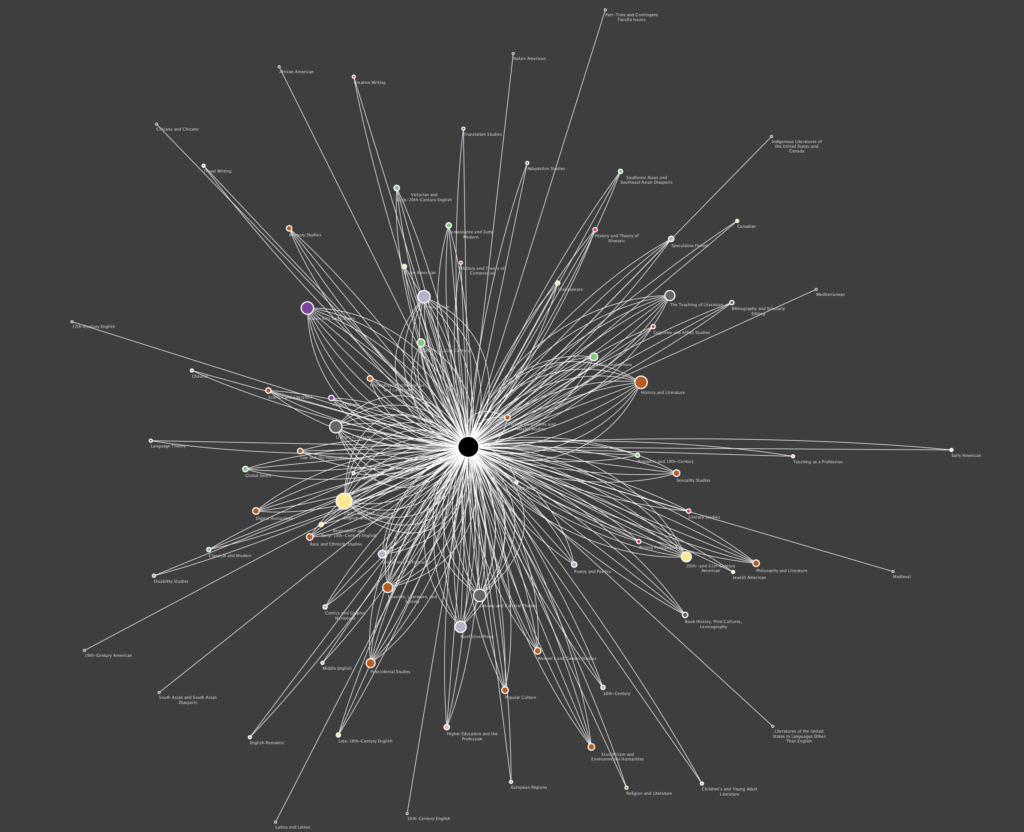
In the spring of 2021, I was requested by Stony Brook University’s English Department to create a series of data visualizations that would display the department’s primary research interests (as they had been identified in a survey sent out to the department’s faculty). Using a combination of Tableau Public and Cytoscape, I ultimately chose to portray the survey’s findings through visualizations that emphasized a network analysis approach.
